

Our real fixed-price bands run $4,000 to $30,000 to build and $50 to $2,000 a month to run. Plus the five numbers most factory AI case studies leave out.

If you are searching for an AI manufacturing cost reduction case study, you are almost certainly trying to answer a budget question: will this pay back, and how fast. Most published case studies cannot answer it, because the number they lead with is a percentage with no denominator attached. "Reduced scrap by 40%" tells you nothing until you know what the scrap was costing, over what baseline period, and what the system cost to build and run. We have scoped enough of these to know which five numbers go missing, and this post is about spotting their absence before you take a proposal to your CFO.
We build the systems, so read this as a vendor being specific rather than a neutral referee. What follows includes our real fixed-price bands and the operating numbers we actually use, not an industry average pulled from someone else's survey.
A case study that opens with "40% fewer defects escaped to customers" is describing a ratio. To turn it into money you need three things it usually omits: the absolute cost of one escaped defect at that plant, how many escaped per month before, and how long "before" was measured for.
Miss any one and the percentage is unusable. A 40% cut on a defect that costs $200 in rework is a rounding error. The same 40% on a defect that triggers a customer return, a containment sweep and a quality audit is a project that pays for itself in a quarter. Same headline, two completely different decisions.
Ask for the denominator first. If the vendor cannot produce it, they did not measure a baseline, which means the improvement is an estimate wearing a number's clothes.
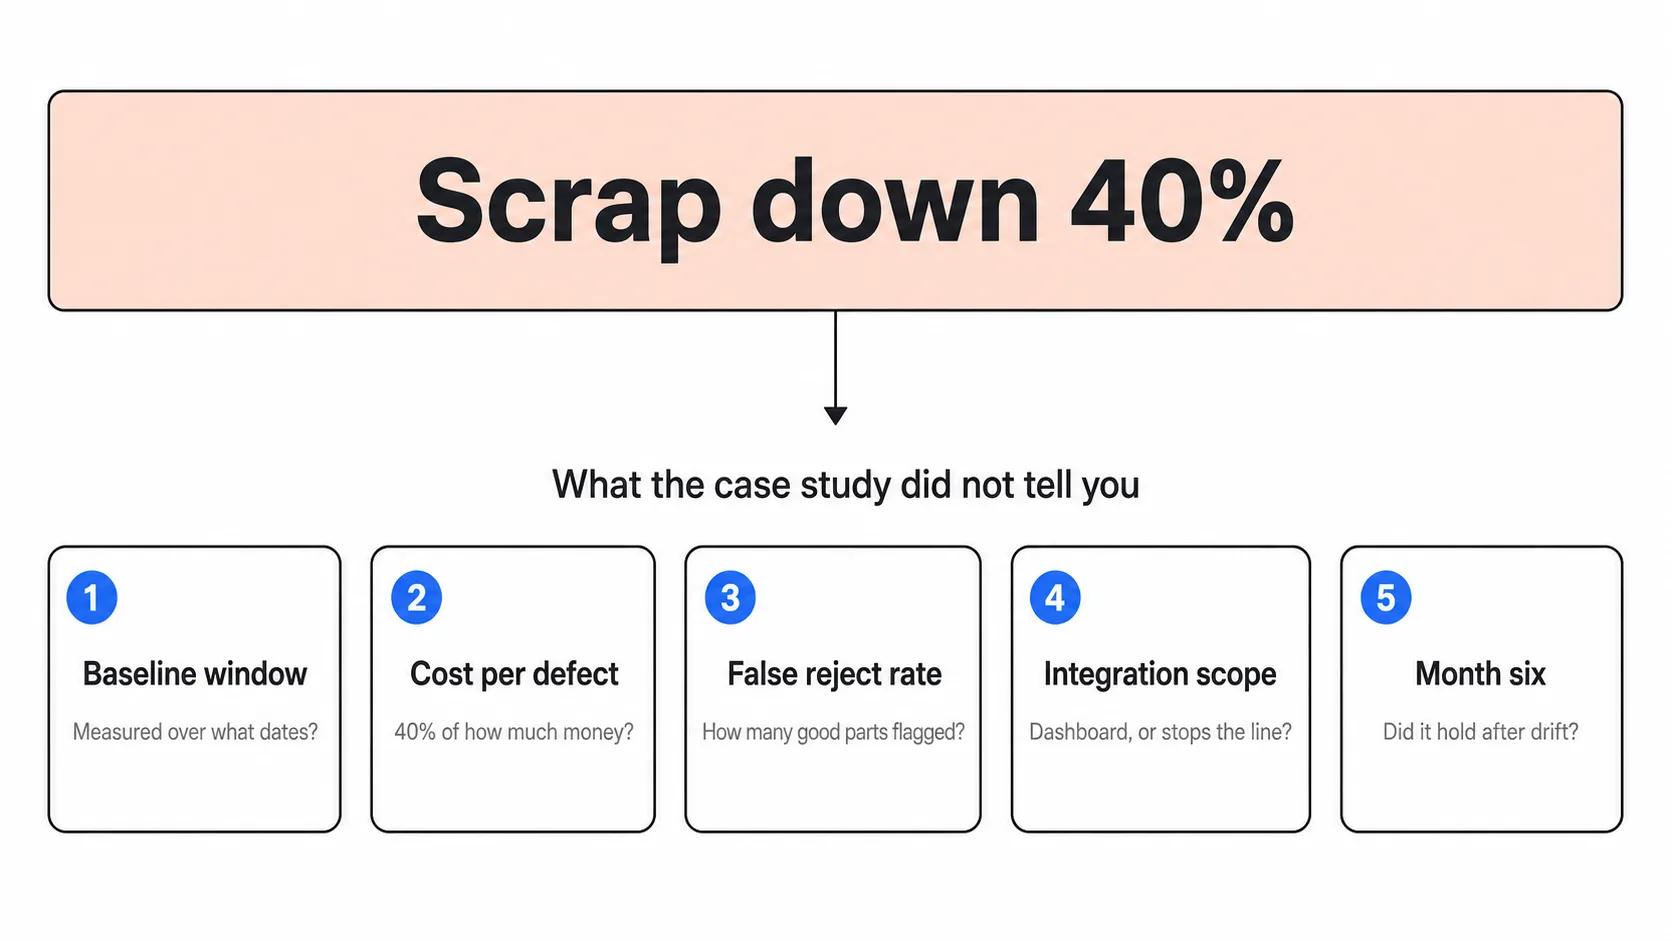
The baseline window. A month of "before" data collected during a seasonal run tells you about that run, not the line. We want at least one full production cycle across the part mix, and the dates written down. When a study says "compared to previous performance" with no window, assume the comparison was chosen after the result was known.
The false reject rate. This is the number that decides whether a system survives on a real floor. A detector that catches every defect by flagging one good part in twenty will be switched off inside a fortnight, and nobody writes a case study about that. We have said in our visual inspection guide that the false reject is the number a plant judges you on, and it is still the first thing we ask for and the last thing we get shown.
Integration scope. Did the system talk to the PLC, stop the line, and write to the MES, or did it draw boxes on a dashboard that a quality engineer checked twice a shift? Both get called deployment. Only one changes cost.
Who did the labelling, and for how long. Data work is the largest single line in most computer vision budgets and it is almost never in the case study. If a plant's own quality team spent six weeks labelling images, that time was real and it was not free.
Month six. Nearly every published study reports a result from the first weeks after go-live. Models drift when suppliers change, when a new part family arrives, when the seasons change what the light through the roof panels does to a camera. A study that stops at week four has not told you whether the system held.
We publish fixed-price bands, so here they are rather than a range someone else surveyed.
A single inspection station checking one defect class on one part family runs $4,000 to $10,000 across three to four weeks, assuming the lighting and part mounting are workable. A full station with anomaly detection, PLC integration, logging and a quality dashboard runs $10,000 to $22,000 across five to seven weeks. A multi-station or multi-site rollout runs $22,000 to $30,000 and up, phased across eight to twelve weeks. We phase those deliberately, because the second station always teaches you something the first one did not.
Running cost is genuinely small. Inference typically sits between $50 and $2,000 a month, and on an edge deployment much of the compute is a one-off hardware line rather than a recurring one. Careful engineering, meaning caching, model routing and prompt design where a language model is involved, cuts that three to ten times over a naive build.
Put those against a denominator you already track and the arithmetic gets simple. If one escaped defect costs you $3,000 in returns and containment and you are escaping four a month, a $12,000 station that catches even half of them pays back inside a quarter. If an escape costs $200 and happens twice a month, no honest version of this project works, and we will tell you that on the call rather than after the deposit.
Across 30-plus production projects delivered since 2024, the pattern has not changed: the systems that pay for themselves are narrow, measurable, and dull.
Visual inspection on one defect class. Reading the paperwork that arrives with the goods rather than typing it in. Watching a machine's own sensor stream for the pattern that precedes a stoppage. Catching a mislabel before the pallet is wrapped. Each of these has a number attached before you start, which is precisely why they can be proven afterwards.
The projects that generate impressive demos and no case study are the broad ones. "AI for the plant" has no denominator either. Most teams do not need a transformation, they need three boring workflows automated properly, and the ones that can be counted are the ones worth doing first.
Honest disclosure, since this post is partly a complaint about other people's case studies. We do not currently publish a manufacturing cost reduction case study with a verified plant number in it.
Two reasons. Our engagements run four to eight weeks from kickoff to live deployment, which puts the meaningful measurement window after our involvement typically ends, and the plants that would have the numbers hold them under NDA. We would rather say that plainly than assemble a study out of projections.
What we can show is the closest adjacent thing. Rope Access Logbook, an industrial safety product replacing a paper logbook, shipped in eight weeks. Its founder, Chad Dubuisson, put it this way: "Codestreaks took our rough idea and turned it into a real product in just 8 weeks. The way they built it saved us months of headaches down the road." That is a real client, a real timeline, and a real quote. It is not a scrap-rate number, and we are not going to dress it up as one.
You do not need a vendor's case study. You need your own baseline, and a week is usually enough to get one.
Pick a single failure that already costs you money and that someone already counts. Pull the last full production cycle for it, with dates. Work out the loaded cost of one occurrence, including rework, scrap, shipping and the hours somebody spends on containment. Multiply. That figure is your denominator, and every proposal you receive should be evaluated against it.
Then ask any vendor, including us, for a fixed price against that specific number and a written false reject target. A supplier who will not commit to a false reject rate has not thought about your floor.
Our fixed-price bands are $4,000 to $10,000 for a single inspection station on one defect class, $10,000 to $22,000 for a full station with line integration and dashboards, and $22,000 to $30,000 and up for a phased multi-station rollout. Running cost is typically $50 to $2,000 a month. Anyone quoting without seeing your part mix and lighting is guessing.
The build runs three to twelve weeks depending on scope. Meaningful savings data needs at least one full production cycle after go-live, across the real part mix, which is why any result reported at week four should be treated as provisional.
There is no realistic industry figure, and treat any single percentage you are quoted as marketing. The calculation is your cost per occurrence multiplied by occurrences avoided per month, set against build cost plus running cost. We walk through that structure for a different sector in our computer vision retail ROI guide, and the arithmetic transfers directly.
Usually because the pilot was measured on accuracy rather than on false rejects and cycle time, so it looked fine in a report and was unusable on the line. We covered how to set that evaluation up before any model is chosen in custom computer vision development.
Yes. Most of our inspection work runs on edge hardware at the station, which keeps latency inside the cycle time and keeps process imagery inside the plant. It shifts cost from a monthly line to a one-off hardware line.
Written by the Codestreaks team. The cost bands, timelines and running-cost figures are our own published fixed prices as of September 2026, not survey averages, and the eight-week Rope Access Logbook delivery and its founder quote are from a real client engagement. The five missing numbers come from scoping conversations across our computer vision work, and we have stated plainly above where we do not have a plant-verified number of our own. Drafting is AI-assisted and every draft gets a human editing pass against the real figures before it ships.
If you are earlier than the budget stage, the wider automation picture is in manufacturing and supply chain automation, and the evaluation mechanics are in custom computer vision development.
If you already have a denominator and want a fixed price against it, that is what our computer vision development work is for. Book a free 30-minute scoping call at start a project and we will come back inside two business days with either a number or an honest reason the arithmetic does not work. We take two engagements a quarter, so a straight no is a real possible answer.
A serial maker of SaaS products and AI agents, I’ve built and launched 10+ tools, grown products to thousands of users, and taken multiple ventures. I share the process what works, what breaks, and how builders can ship faster and smarter. Previously a data scientist at a Big Four consulting firm.


